Technology
Amazon’s Massive Distribution Network in One Giant Visualization
View a high resolution version of this graphic.
Amazon’s Massive Distribution Network in One Visualization
View the high resolution version of today’s graphic by clicking here.
Last year, Amazon shipped over 5 billion (with a “B”) Prime packages, and the retail giant’s ecommerce market share in the U.S. is on the verge of surpassing 50%.
Moving that kind of volume takes an impressive amount of technical sophistication, manpower, and distribution infrastructure. While Amazon does lean on third parties for deliveries and warehousing, the company is also building an increasingly expansive distribution network in an attempt to manage the entire process.
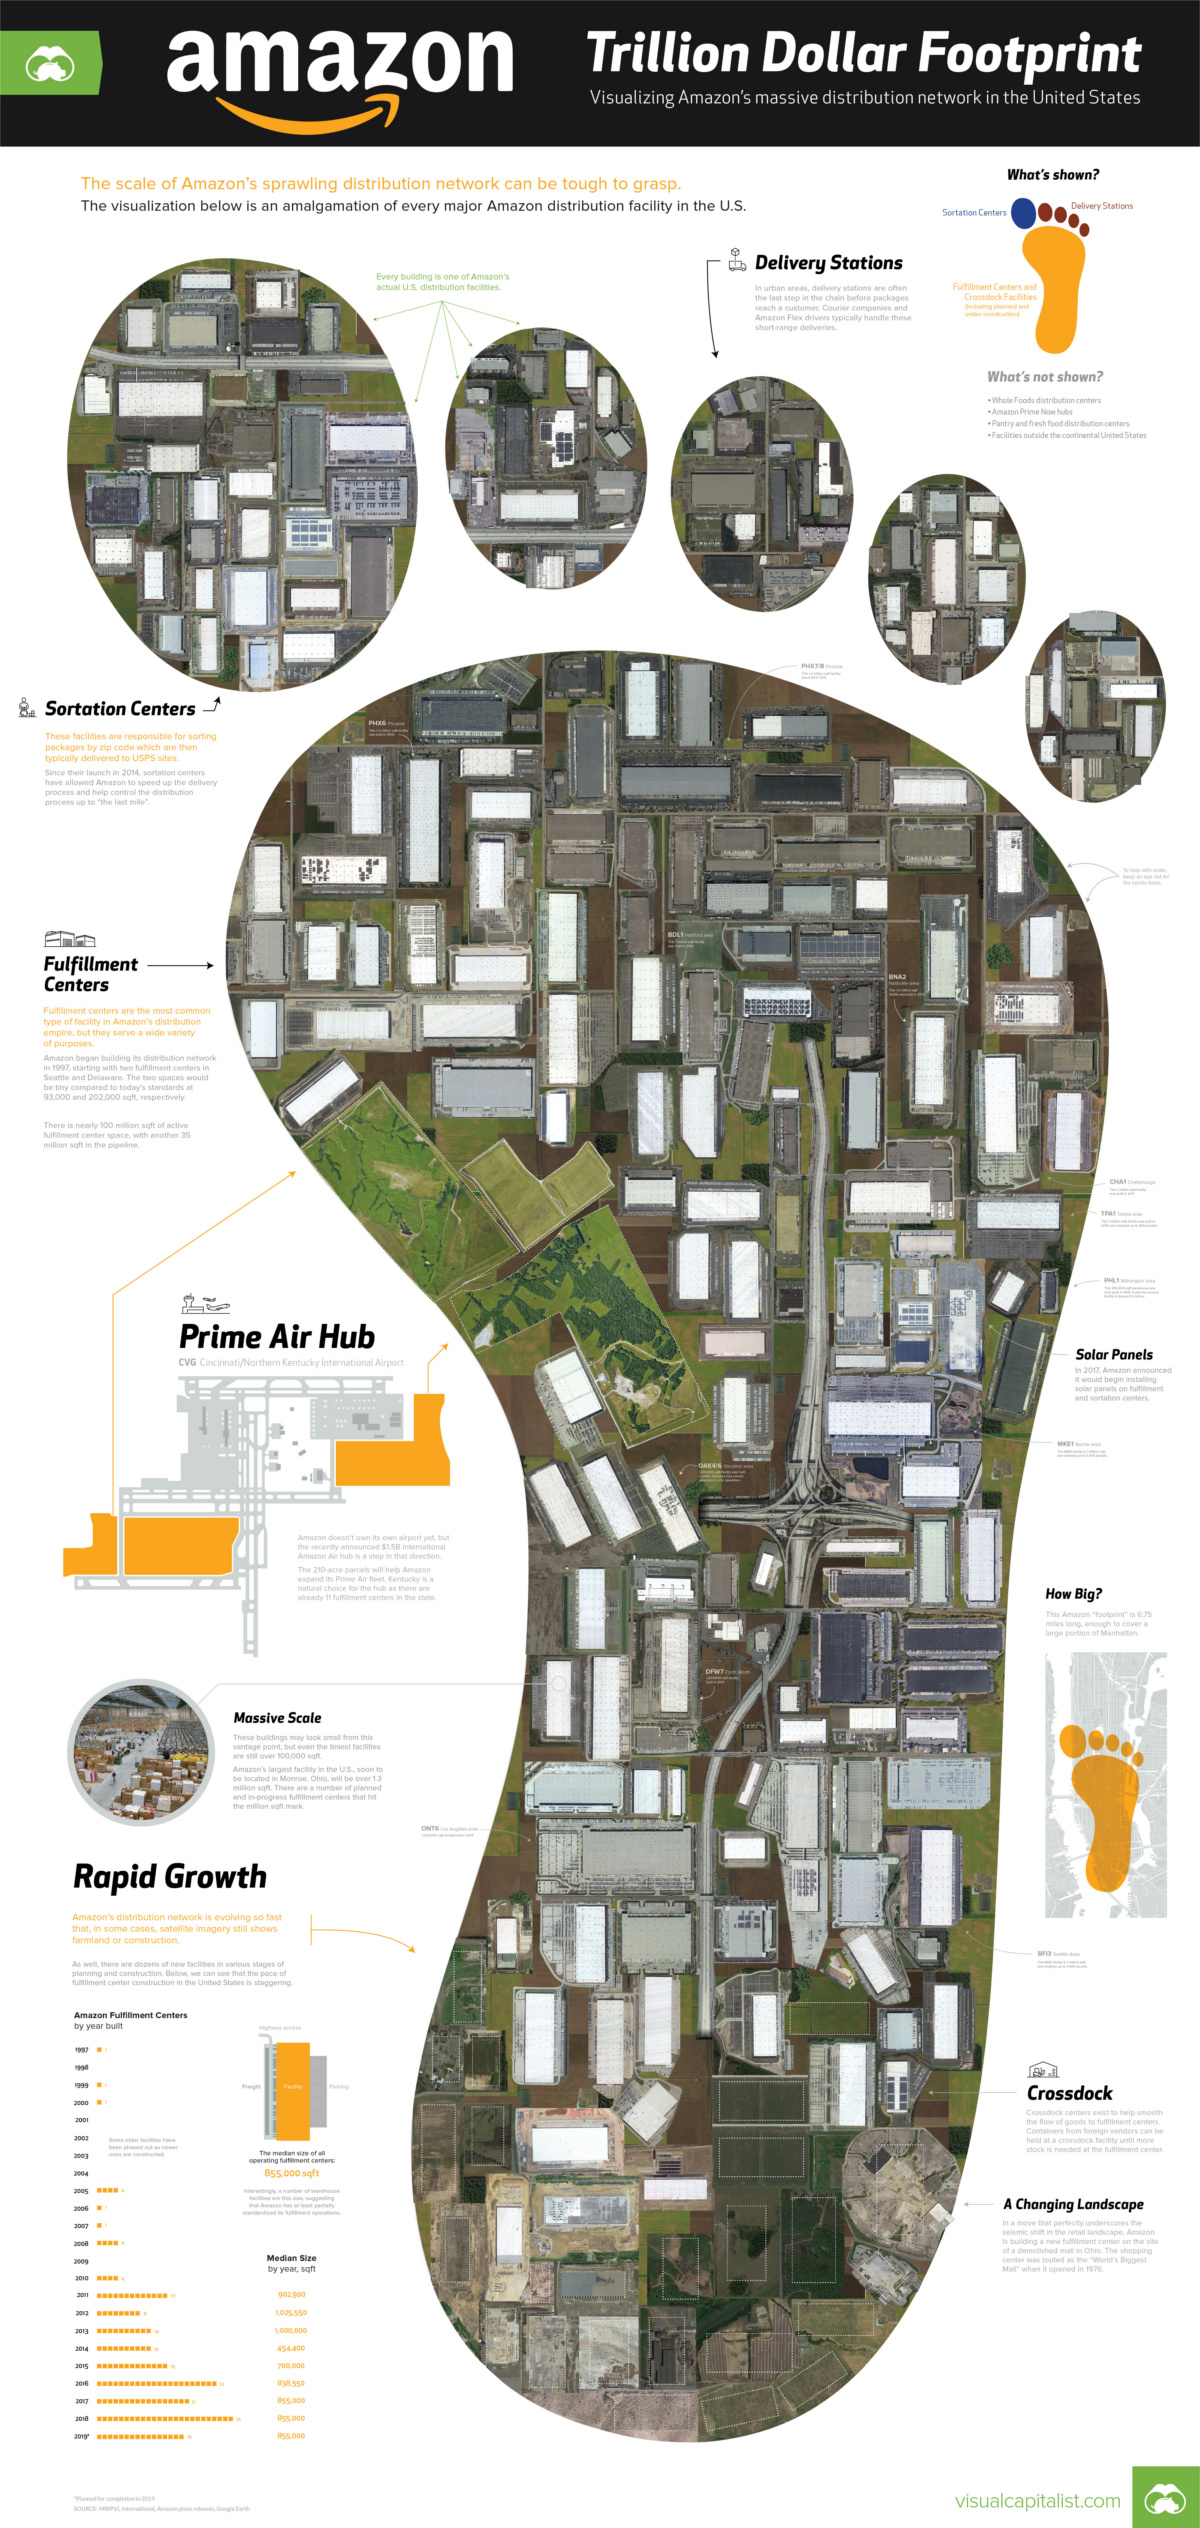
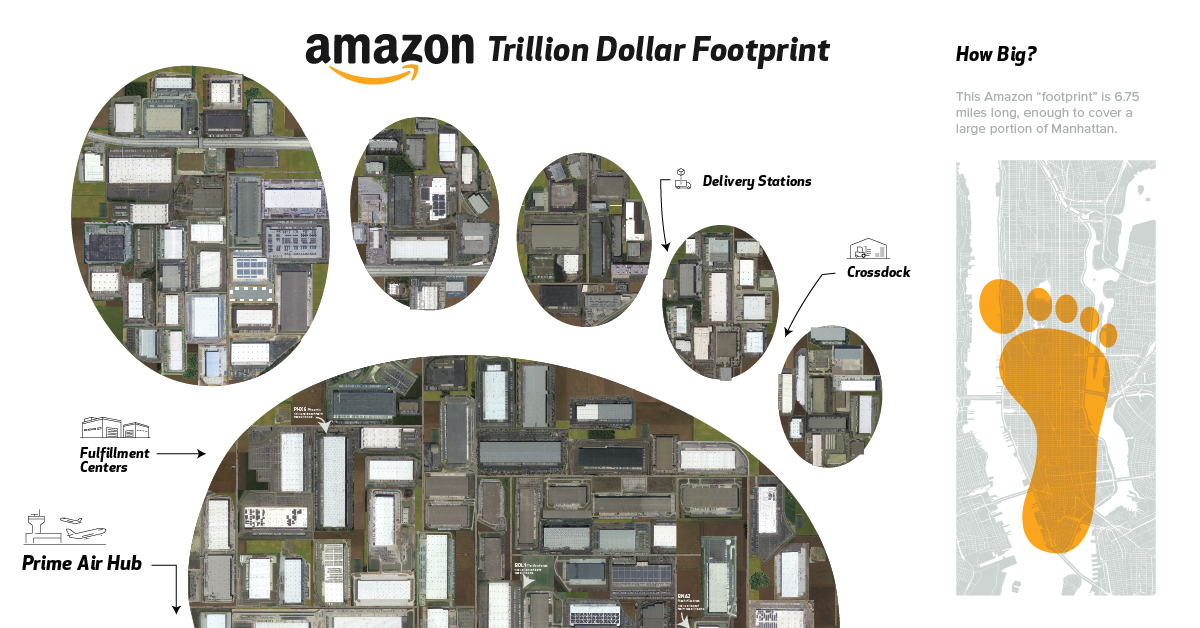
Today’s visualization, which uses comprehensive data from MWPVL International, examines the estimated 124 million square feet of active space in the U.S., as well as the 40 million in Amazon’s construction pipeline.
To create our graphical footprint of Amazon’s warehouses in the infographic, we’ve used satellite imagery of every Amazon facility in the U.S. and stitched it all together.
Pieces of the Puzzle
There are a few types of facilities that make up the vast network of Amazon’s warehouses:
Crossdock Centers
Containers from foreign vendors can be held at a crossdock facility until more stock is needed at the fulfillment center. This is the back-end of the distribution chain.
Fulfillment Centers
Fulfillment centers are the most common type of facility in Amazon’s distribution empire, but they serve a wide variety of purposes.
Amazon began building its distribution network in 1997, starting with two fulfillment centers in Seattle and Delaware. The two spaces would be tiny compared to today’s standards at 93,000 and 202,000 square feet, respectively. Now, there is nearly 100 million square feet of active fulfillment center space, with another 35 million on the way.
Sortation Centers
These facilities are responsible for sorting packages by zip code which are then typically delivered to USPS sites. Since being introduced in 2014, sortation centers have allowed Amazon to speed up the delivery process and to help control the distribution process up to “the last mile”.
Delivery Stations
In urban areas, delivery stations are often the last step in the chain before packages reach a customer. Courier companies – and increasingly Amazon Flex drivers – typically handle these short-range deliveries. These stations are often located near airports.
Prime Now Hubs
These smaller locations are specifically designed for speed. Prime Now hubs carry a more limited selection of items – including Whole Foods inventory – that are delivered within two hours of clicking “buy”. There are currently around 50 of these facilities in urban areas around the United States, but that number is expected to increase dramatically in the near future.
Prime Air Hub
Amazon doesn’t own its own airport yet, but the recently announced $1.5B international Prime Air Hub is a step in that direction.
The 210-acre parcels will help Amazon expand its Prime Air fleet while reducing its reliance on companies like UPS and FedEx. Kentucky is a natural choice for the hub as there are already 11 fulfillment centers in the state.
Fighting for the Last Mile
Over the years, Amazon has optimized every aspect of the distribution system, but one final hurdle remains.
Conquering the last mile – the final leg before a package reaches its destination – has proven tricky, in part because USPS already has a well-honed strategy for delivering to all the nation’s residents.
The company’s earnest recruitment drive for Amazon Flex is the latest in a long line of attempts to decrease reliance on third parties for package delivery. Also, by tapping into on-demand labor, Amazon hopes to reduce costs and have more flexibility during volume surges like Black Friday.
This desire to own the entire process is being reflected in the company’s roster of distribution facilities. The massive fulfillment centers aren’t going anywhere, but we may see a lot more smaller delivery hubs in cities and towns across America.


Technology
What Laptop Brands do Americans Use in 2024?
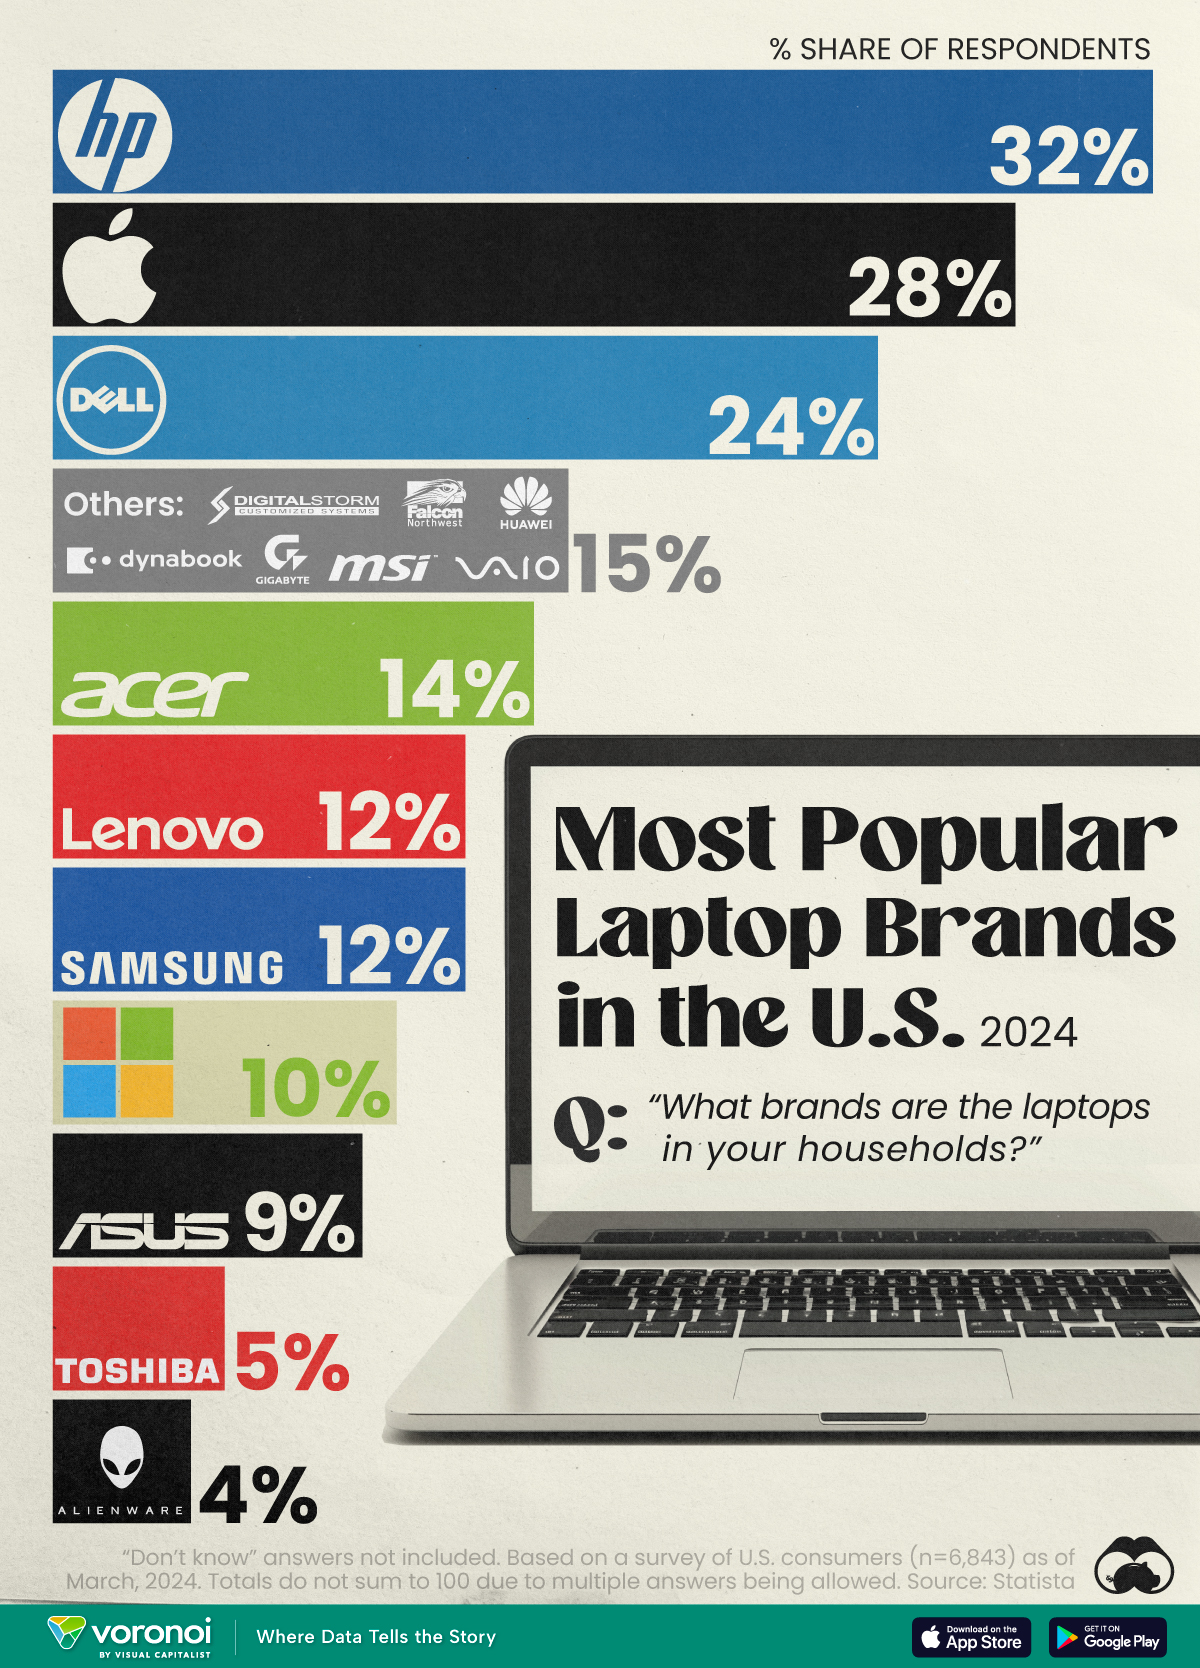
Statista surveyed nearly 7,000 American adults aged 18–64 asking them what laptop brands were in their households. These are the results.
What Laptop Brands do Americans Use in 2024?
This was originally posted on our Voronoi app. Download the app for free on iOS or Android and discover incredible data-driven charts from a variety of trusted sources.
We chart the market share of commonly used laptop brands in the U.S., per Statista survey data. Multiple responses were allowed, and percentages do not sum to 100.
The U.S. Laptop Market Landscape
HP emerges as the preferred choice for laptops, present in 32% of surveyed households.
Meanwhile, Apple’s dominance in America’s smartphone segment isn’t quite matched in the laptop market with their Macbooks, trailing HP at 28% of households.
Here’s the full survey data.
| Brand | Share of Respondents |
|---|---|
| HP | 32% |
| Apple | 28% |
| Dell | 24% |
| Acer | 14% |
| Lenovo | 12% |
| Samsung | 12% |
| Microsoft | 10% |
| ASUS | 9% |
| Toshiba | 5% |
| Alienware | 4% |
| DigitalStorm | 2% |
| Falcon Northwest | 2% |
| Huawei | 2% |
| MSI | 2% |
| Vaio | 1% |
| Other | 6% |
| Don't know | 2% |
Note: DigitalStorm, Falcon Northwest, Huawei, MSI, and Vaio’s share of respondents were combined into the “Other” category in the graphic. “Don’t know” responses were not visualized.
Another well-known manufacturer, Dell, comes in at 24%, rounding out the top three by household share.
Other big laptop brands, Acer, Lenovo, Samsung, and Microsoft all range between 10–15% of surveyed households.
For a broader picture, market research firm, Technavio, predicts a 3.2% combined average growth rate for the global laptop market from 2024–28. A lion’s share of that growth (42%) is expected to come from North America. Rising popularity of gaming laptops will be a key tailwind.
Interestingly, thanks to their graphics processing units, gaming laptops are also in demand for AI/machine-learning work. Some companies have already started releasing models catering to this specific audience.
Learn More About Tech From Visual Capitalist
If you enjoyed this post, check out The Top 100 Most Valuable Brands in 2024 where technology companies make up nearly one-fifth of the list by themselves.

-

 Energy1 week ago
Ranked: The World’s Largest Lithium Producers in 2023
-

 Public Opinion2 weeks ago
Charted: How Democrats and Republicans View Government Agencies
-

 Globalization2 weeks ago
Mapped: The Top Exports in Asian Countries
-

 Finance2 weeks ago
Ranked: The World’s 50 Largest Private Equity Firms
-

 United States2 weeks ago
Mapped: The 10 U.S. States With the Lowest Real GDP Growth
-

 China2 weeks ago
Comparing New and Current U.S. Tariffs on Chinese Imports
-

 Politics2 weeks ago
Which Countries Have the Most Economic Influence in Southeast Asia?
-

 population2 weeks ago
The Top 25 Nationalities of U.S. Immigrants